Industry
Archery and Bowhunting Highlights from the NDA’s 2022 Deer Report (Plus Other Industry Data)
Get the facts on bowhunting participation and deer harvest numbers nationwide.
Photo Credit: ATA
The National Deer Association published its “Deer Report 2022” in January. The 55-page document has tons of facts and statistics about deer and deer hunting. We’re partial to bowhunting and archery information, so we zeroed in on what the report had to say about that. Here’s what we found — along with some other great sources for related information..
The NDA’s “Deer Report 2022” compiles information from all 48 contiguous U.S. state wildlife agencies for their 2020 to 2021 deer seasons. It often groups the data by region, including the Southeast, Northeast, Midwest and West. Please download the report to see the regional breakdown, the archery statistics listed below and other information about hunting in the U.S.
The 2022 report has comprehensive bowhunting participation and harvest numbers. NDA’s former organization, the Quality Deer Management Association, compiled extensive bowhunting information from the majority of state wildlife agencies in the past but stopped. The NDA plans to include this information annually, which will make the report one of the best resources on continuous bowhunting participation and harvest data for ATA and industry members.

Download the NDA's report. Photo Credit: Bowhunters United
According to the report, there are 9.5 million deer hunters nationwide, 3.5 million of which are archery hunters. The Northeast had the highest number of deer hunters partaking in firearms season (90%) as well as archery season (43%) and muzzleloader season (26%). The West had the least participation in the archery season at 17% of deer hunters, outperformed by the Southeast at 33% and Midwest at 37%.
Individually, Pennsylvania had the highest concentration of archery hunters at 334,000, followed by Michigan at 322,000, Wisconsin at 309,501, New York at 251,182, and Missouri at 207,044. The state with the fewest bow and crossbow users was Nevada at 2,900; next was Rhode Island with 3,300 and then Wyoming at 4,000. Obviously, a state’s total population affects the number of license-buying hunters. This information can be found on pages 20 and 21 of the report.

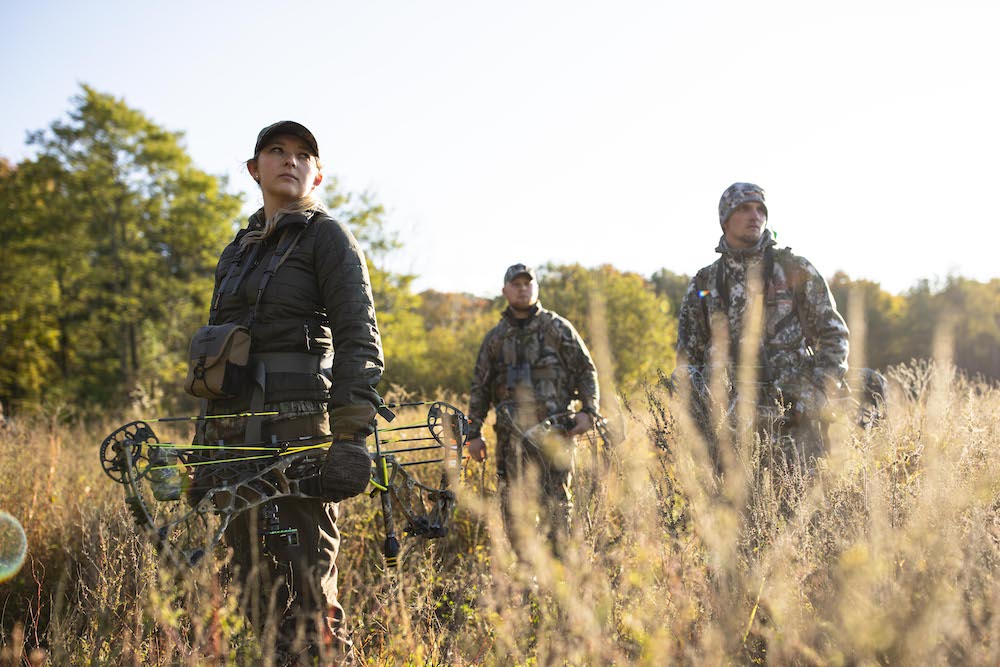
Take a look at the bowhunting stats and compare it to previous years. Photo Credit: ATA
The report found that archers take 26% of the annual deer harvest, compared with 65% for firearms hunters and 9% for muzzleloader hunters. The archery harvest is up 1 percentage point from the 2021 report, which overviewed the 2019 to 2020 season.
Bowhunters in the Northeast states had the highest percent of the overall harvest, which, on average was 35% compared to the Midwest at 28%, the Southeast at 16% and the West at 9%. On a state-by-state basis, New Jersey leads the U.S. in the percentage of total harvest taken by archers (64%), making this its fifth consecutive year for the title. The four following states also held their rankings from the previous year: Connecticut (58%), Massachusetts (50%), Ohio (48%) and Illinois (46%). Aside from New Jersey, which dropped a percentage point from the previous report, the other four states had an increase in archery harvests. This information can be found on page 14.

WE ARE HERE TO HELP THE INDUSTRY, TO HELP INDIVIDUAL BUSINESSES GET THE MOST OUT OF THE INDUSTRY, AND TO HELP YOU.

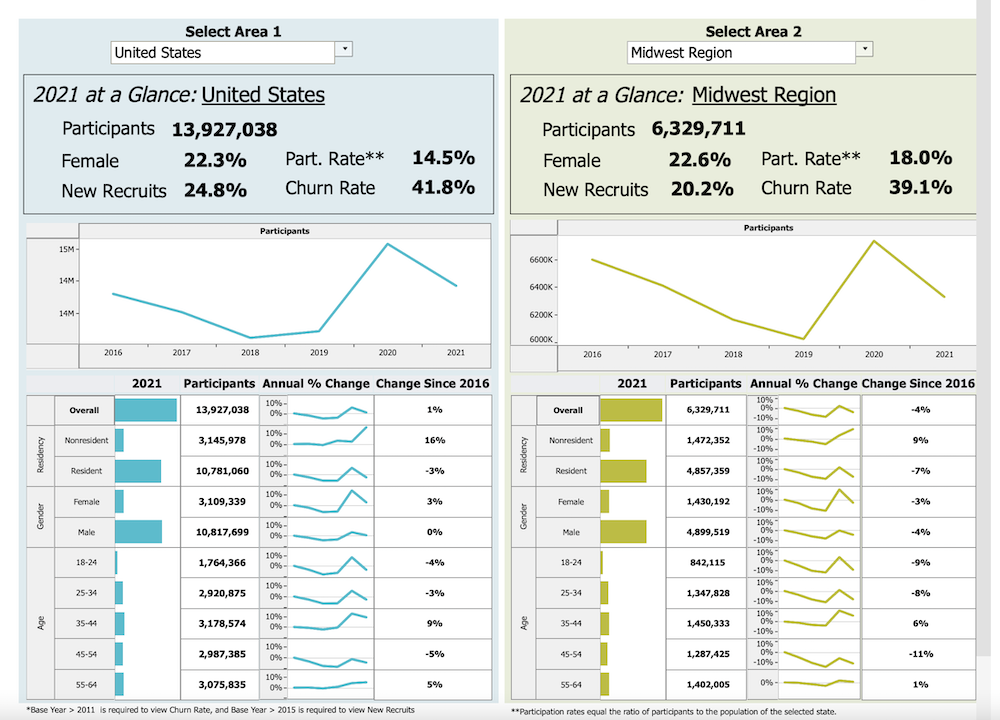
The data dashboard breaks down outdoor industry statistics in easy-to-follow- side-by-side comparison tables. Photo Credit: ASA
If you’re curious about archery and bowhunter participation numbers and trends, there are multiple resources available. In fact, many show exciting, promising statistics for the archery and bowhunting community. Here are a few resources to explore.
1. National Sporting Goods Association Participation Report for 2021:
The National Sporting Goods Association compiled and compared nationwide participation numbers for 31 sports and activities among Americans 7 years old and older. The report is available to NSGA members for a fee. It includes participation estimates for target archery as well as the number of Americans who went hunting with a bow and arrow each year. These numbers are compared with other activities such as basketball, boxing, canoeing, cheerleading, fishing, football, gymnastics, hiking and ice hockey. Visit the NSGA website to learn more or request the document.
2. National Hunting License Data Report:
The U.S. Fish and Wildlife Service reports the number of hunting licenses sold by each state wildlife agency each year. The data combines licensed hunters of all types, including individuals who may not have hunted, but had to buy a license to apply for big-game draws or to shoot at a public range. The document also breaks down the number of licenses sold to residents and nonresidents, as well as the financial yield from each category. The total number of licenses, tags, permits and stamps sold in the US in 2021 was over 34 million. Thirteen states sold over 1 million each, including Michigan and Pennsylvania with over 2 million and Wisconsin with over 4 million. The resource can be found on the USFWS website.
3. The Data Dashboard:
The ATA partnered with the American Sportfishing Association, state fish and wildlife agencies, and others to create a real-time data dashboard that will allow states and industry members to get an accurate picture of statewide license sales data and information. The dashboard uses automatic, secure data transfer protocols to regularly compile license sales data from a sample of participating states in a central location with direct links. Users can search by year, region and state, and find information on hunting, bowhunting and fishing. The dashboard found nationwide license purchases grew 15% for women and 4% for men between 2019 and 2020. Click here to access the Data Dashboard.
If you have questions or need help finding a resource, please contact the ATA business, membership and Trade Show office at (507) 233-8130.
